
Feb 8, 2019
Whether you are new to Instagram’s world of analytics or already have certain knowledge and experience, you will find it necessary to have a guide of the right metrics to keep track of this new 2019 year. Particularly the right metrics will help you understand your audience better and get a big payoff for that!
So, here are the five most important Instagram metrics you should track during the upcoming 12 months for running an effective marketing campaign.
Engagement Rate
Do you know what is the direct indicator of how your audience responds to your content on Instagram? That’s right, Instagram engagement rate! Depending on how many likes, comments and shares your posts gather, the engagement rate can be high or low. If you are not aware how you should calculate this rate, here is a universal consensus: the total number of comments and likes must be divided by the number of your followers, and the result should be multiplied by 100. As a result, you will get a precise percentage. Keeping track of your engagement rate will let you better understand what type of content your audience likes the most.
Best Time to Post
Posting at the wrong time means losing much following and thus preventing a high engagement rate. Depending on the business you have on this social media, as well as your audience, the best time may differ. However, here is a chart to use as a starting point before you can detect those particular hours particularly your audience is most active at.
To help you find out your best time for posting, we shall advise having a glance at the Insights. Once you find the Audience tab there, you will get the breakdown (both days of week and times of day) of when your followers are most active online.
Reach
The first aim of any Instagram user is to grow their account in this new 2019 year. For this, it’s critical to keep track of the reach metrics on Gram. This is the number of unique views that your posts, Stories, and advertisements get. Particularly this metric will show you whether your posts reach new audiences and grow your account. To find the reach statistics of your Instagram posts, go to the Insights. Navigate to the Content tab and tap See All. After this, filter and break down the content by its type (this can be video, photo, carousel, shopping) and by Gram metrics (choose the reach). In case no improvements are stated, it’s worth re-considering the hashtags, captions or even the type of content you share. Just experiment and track the reach.
Stories Audience Retention Rates
It’s far not easy to create valuable Instagram Stories that will engage your audience. If your aim is to create such Stories that will keep all your followers interested from start to finish, pay attention to Instagram Stories reach metrics. The latter will show how each of your Story’s slide performed during the past 24 hours. Calculate the drop off rate of your Stories to find out how many viewers stopped watching your Story before they reached the end.
Traffic and Sales from Instagram
If your Instagram account is devoted to selling certain products, most probably you’d like to find track particularly which shoppable posts performed better than others. For this, click on View Insights on a particular shoppable post and sort top posts on different metrics right though Insights on your business profile.
You see, there isn’t anything complicated in tracking the most crucial five Instagram metrics. Do this, if you plan to boost your account’s popularity this year!
May 22, 2018
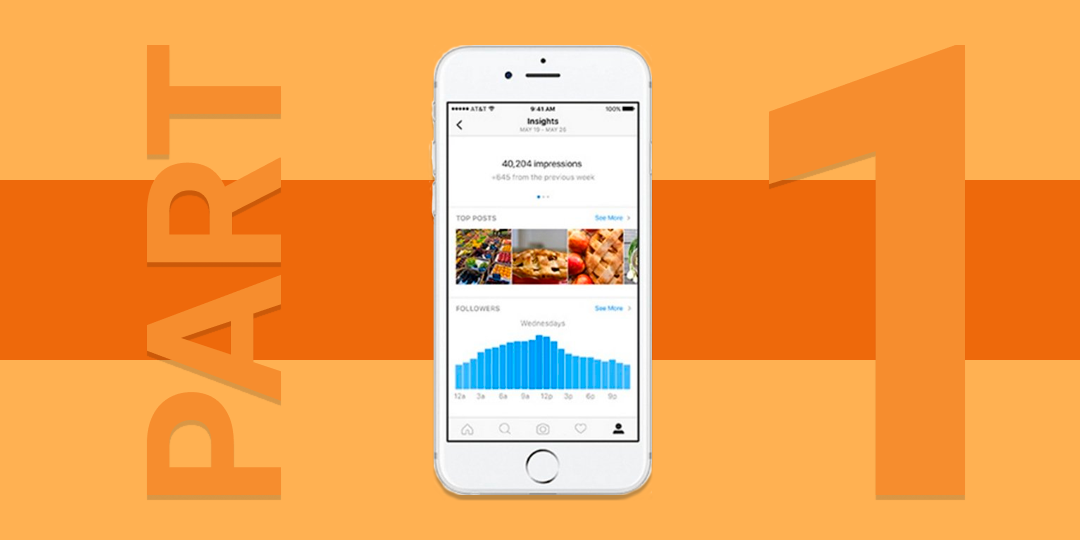
Welcome back to the article devoted to Instagram metrics! Today, we’ll continue the previous list of metrics pursuing a goal to make it easier for you to scheme a strategy for enhancing your Instagram business, and watch its growth. And so, let’s get down to work!
Views
Based on a certain date range picked up by the user, he/she can count the views a video post has gathered. This will be called “views”, and the view rate of a video post can be calculated by dividing the number of views by the impressions it got.
Branded Hashtag Tags
Once you create a hashtag in order to a arise a certain community around your brand, it will be named as a “branded hashtag”. And the number that very hashtag was used for posting media is referred to as “tags on hashtag”.
Exits
Not all Instagram users watch your stories up to the end. And once they leave it, it is counted to the Exits. The latter can happen in one of the following cases:
- Closing Instagram while watching the Story
- Taping the X button on the right up corner of the Story while watching it
- Swiping down the whole media and getting back to the basic feed
By dividing these Exits by the number of impressions the story gets, you’ll find out its exit rate.
For instance, if your Instagram Story has collected 300 impressions, while the exits are 50, the exit rate will be equal to 6%.
Swipes Away
In the Insights of Instagram, you can also come across a metric named “swipe away”. The latter signifies how many Instagram users swiped to the left or right your story without watching it, thus passing to others’ stories.
Taps Forward
This metric was added to the Insights of Instagram to show off how many taps were made to view your next photo/video in the Story. A great number of taps forward would indicate the story was either too long or not interesting, and this drew people to tap forward to get to its end. By the way, an improperly composed Story can also lead to a rise of taps forward. For example, if there is a sticker on the right side of your story, it may lead to this.
Taps Back
“Taps back” is the metric that shows how many times a part (a photo or video) of your story was tapped back for re-watching. If you have a high number of taps back in the insights of your Instagram, it will mean people really liked your previous story and wished to re-watch it over again. If you are judging the performance of your content, it is obviously better to get a higher number of taps back than taps forward.
Shortcuts
The four previously-mentioned metrics (taps back, taps forward, exits and swipe aways) together form the Shortcuts. Before your serial Instagram story ends, the Shortcuts matter a lot.
Live Viewers
Perhaps the biggest trend on Instagram social network nowadays is going live. If you are fond of live posts, then you also need to check the number of live viewers. Every time an Instagram user joins your live broadcasting, he is counted to this rate. The number of your live viewers can be found on the screen’s top-left corner right after going live.
InstaBF, the leading supplier of Instagram likes, comments and followers in the industry, presented to your attention the basic metrics every business profile owner should be aware of. All these metrics, along with the Instagram ADS metrics (click-through rate; cots per click; average cost per click; clicks) will help to build up your business Instagram strategy.
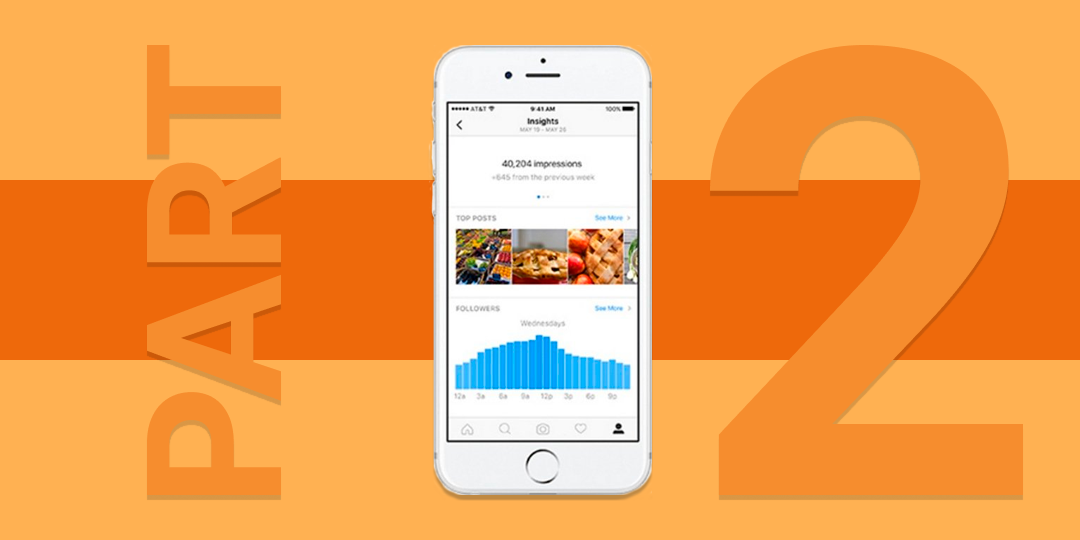
May 20, 2018
Reach and impressions, taps back and taps forward, engagement rates … All these Instagram buzzwords may sound unfamiliar to you, yet you should start getting to know them better if you want to develop your Instagram business. With today’s wild competition among multiple brands and influencers, it will be simply impossible to achieve any success without understanding Instagram metrics and working out a good strategy. The latter is composed of three main parts and the absence of any will lead to a total collapse. These are a comprehensible goal, actionable tactics, and measurable performance metrics. So, in the upcoming two brief articles, InstaBF, one of the most reliable sources for ordering Instagram likes comments and followers, will try to present all the crucial Instagram metrics in the clearest way. Let’s get down to the Part 1 of Instagram metrics you should be aware of!
Reach
Reach is the exact number of Insta users who have seen the post you’ve made, while the reach rate is calculated by dividing the reach by the number of your followers. And if you can find the reach expressed in numbers, the reach rate is always presented in percentage.
Impressions
Impressions are calculated by counting how many times your post/profile or story has been seen during a fixed time period. This number is not related to the reach, as one person can view your post, story or profile multiple times.
Engagement
To calculate the engagement rate, it’s necessary to divide the number of all likes, saves and comments by the number of your followers at that particular time. Just the same way, by dividing the comments, and saves of a certain post likes by the same post’s reach, you will reveal the engagement on reach. By the way, the more followers there are, the less the engagement rate is. Even such a popular Instagram celebrity as Kim Kardashian, who has around 109 million, has to be content with only 1.97% engagement rate per post. These metrics can be found under every post’s insights, if your account is business, of course.
Growth of Followers
Followers growth is possibly the most obsessed-over metric. Actually, it’s a surplus of followers attracted over a certain time. If you find your current follower growth is not satisfying, or you are even experiencing a crazy loss of followers, then it’s worth considering to review the strategy you are currently adhering to.
Email Clicks
Every Instagram business profile has an email mentioned in the bio. The number of taps on this link is that very email click. To calculate its rate, it’s crucial to divide the number of email clicks by that of profile views. For instance, if your business profile was visited 50 000 times while your link was clicked 50 times, your email click rate will be 0.01%.
Just the same way, it’s possible to calculate the Website click rate and “get directions” click rate.
Saves
The number of saves a post gathers, forms the saves, while the average saves can be calculated by dividing the number of saves by the posts made during a fixed time period. As a rule, this time period is a month.